Overview
This is a project created in partnership with The San Diego Association of Governments (SANDAG) under UC San Diego’s Halıcıoğlu Data Science Institute undergraduate mentorship program. The work was conducted as our final capstone project and is meant to serve as a proof-of-concept for the use of “algorithmic” machine learning to augment and improve SANDAG’s current forecasting methodologies.
📝 NOTE: This site is catered towards an audience with little data science knowledge. For technical details and implementation look to our code repository and paper.
Why Establishment Birth-Death Forecasting?
Knowing when businesses are born and when they close down is important for figuring out what’s going on in the job market and the economy. Birth data tell us how many new businesses are starting up and where the action is, while death data show us which businesses are struggling and where resources are moving away from. Having accurate info on business births and deaths is key for local governments to plan ahead. It helps them understand how entrepreneurship is doing in their area and make smart decisions about policies and development.
Effective and accurate forecasts allow government organizations to peek into the future and make better planning decisions. Knowing the projected rate of business births and deaths for the upcoming year can help local governments allocate resources more efficiently, target support services to areas with high entrepreneurial activity, and implement policies that foster business growth and sustainability.
As a local transportation planning organization, SANDAG, whom we collaborated with in partnership on this project, utilizes such forecasts to identify areas of future growth, correlated with increased transportation demand, to inform future transportation development.
The Current State of Regional Forecasting
Despite the recent rise in popularity of Machine Learning and AI with products such as ChatGPT and Tesla’s Self-Driving Assistance Systems, regional forecasting techniques still rely heavily on comparatively simple models built upon the backs of rigid statistical theory. The problem, however, is that the simplifying assumptions these models are built upon have mostly fallen apart with the recent COVID-19 pandemic, leading current forecasts to vastly overpredict business growth despite the recessionary period.
What Did We Do?
Seeing this, we wondered if “algorithmic” machine learning techniques, particularly neural networks, which most current bleeding-edge AI products are built on, could address the overprediction we are currently experiencing by learning from the past and forecasting recessionary years before they happen. While doing this, we focused on data from San Diego County, to ensure that our results are easily applicable to SANDAG’s work.
A Sneak Peek of Our Final Forecasts…
Forecasted Establishment Counts by ZIP Code (San Diego) for 2021:
Data
What Data We Wanted
We first researched the types of data and features used by other counties for regional business growth forecasting and also referenced features mentioned in scholarly articles on business growth forecasting methods to get an understanding of current features that are commonly used and to brainstorm new, potentially relevant features. Afterwards, we created a list of features that we found relevant or supported by economic research that we wanted to collect and train on. As we found out, accessing and finding datasets with all of the features at the level of detail we wanted turned out to be more difficult than expected.
In an ideal scenario, to predict the births and deaths of businesses in the region, we would love to have detailed data broken down by months, covering many years, by small geographical regions like census blocks. Unfortunately, due to security concerns, this level of detailed data is usually limited to government use and isn’t accessible to everyone else.
In addition to this, features like payroll by industry were not available at the ZIP code level, resulting in us settling for general payroll by ZIP code data.
What Data We Used
Due to the data constraints, we were especially limited in the geographical area breakdowns we could acquire data for, with most data being available only at the state and national levels. However, to keep within San Diego County, however, we would need data broken down below the county level. In the end, we were able to acquire data on the number of establishments by year and ZIP Code. To get data at the ZIP Code level, we had to forgo establishment birth and death counts, and substitute them with total establishment counts as an approximation.
To leverage potential insights from other indicators, we also collected and analyzed data representing processes identified, by previous economic research, to have significant explanatory power for regional variations in establishment birth and death rates.
📝 NOTE: All of our data were collected from U.S. Census datasets, with exact sources in our paper.
How Does the Data Look?
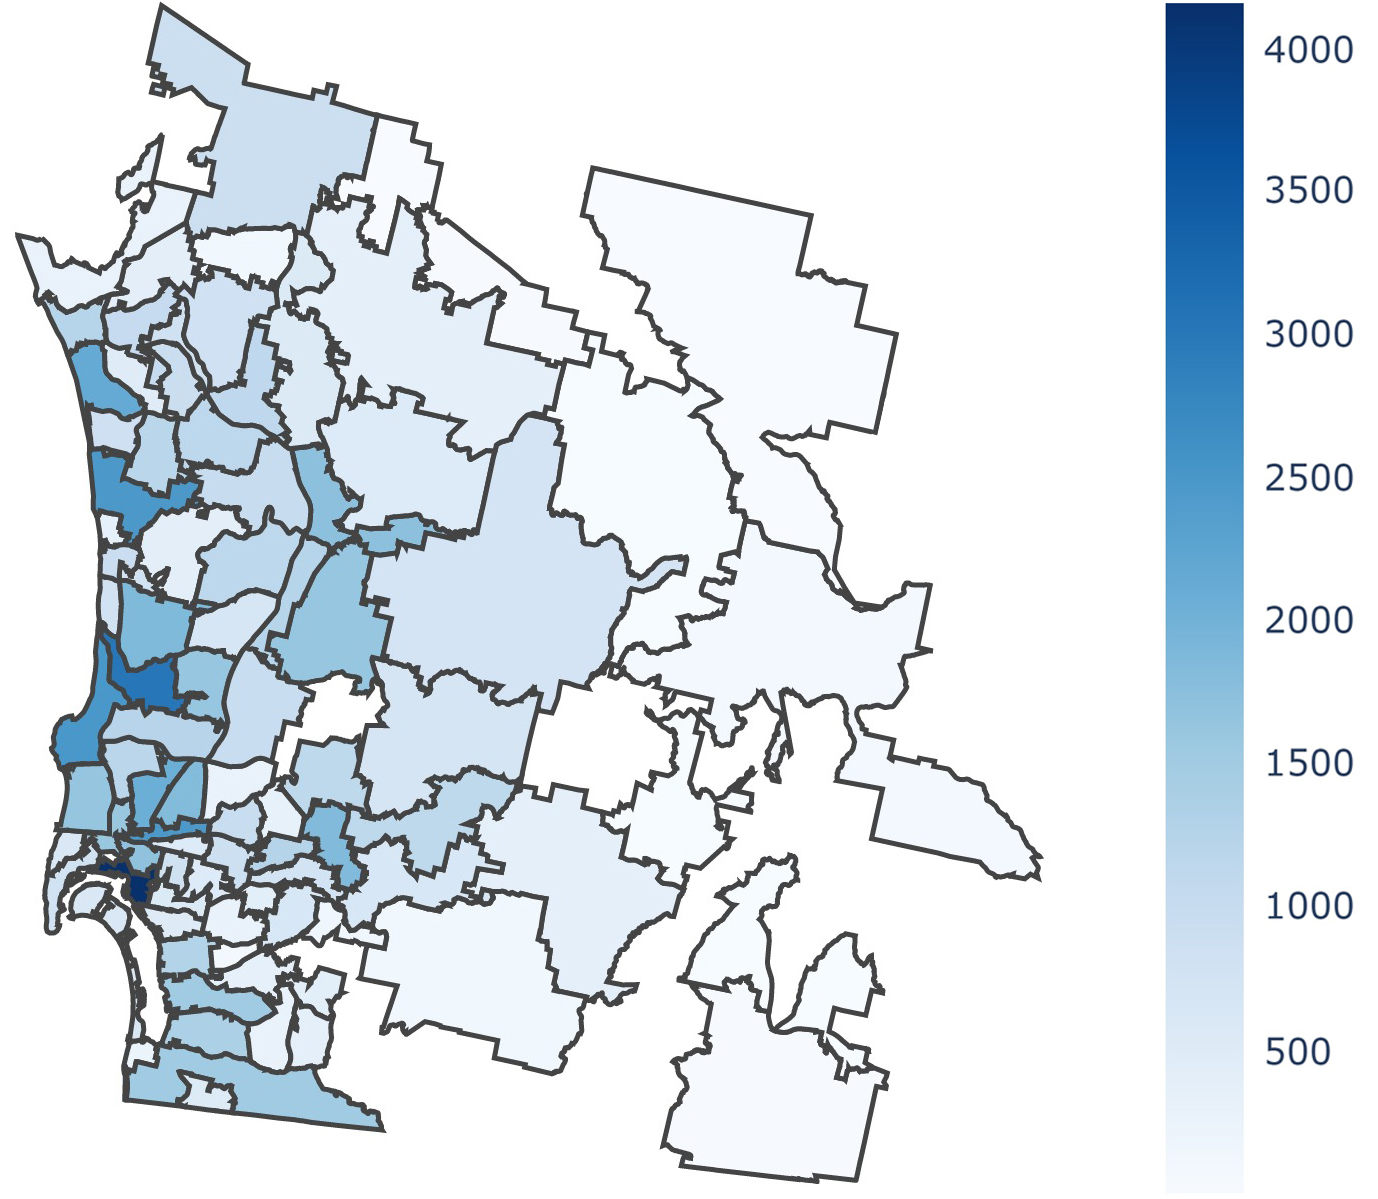
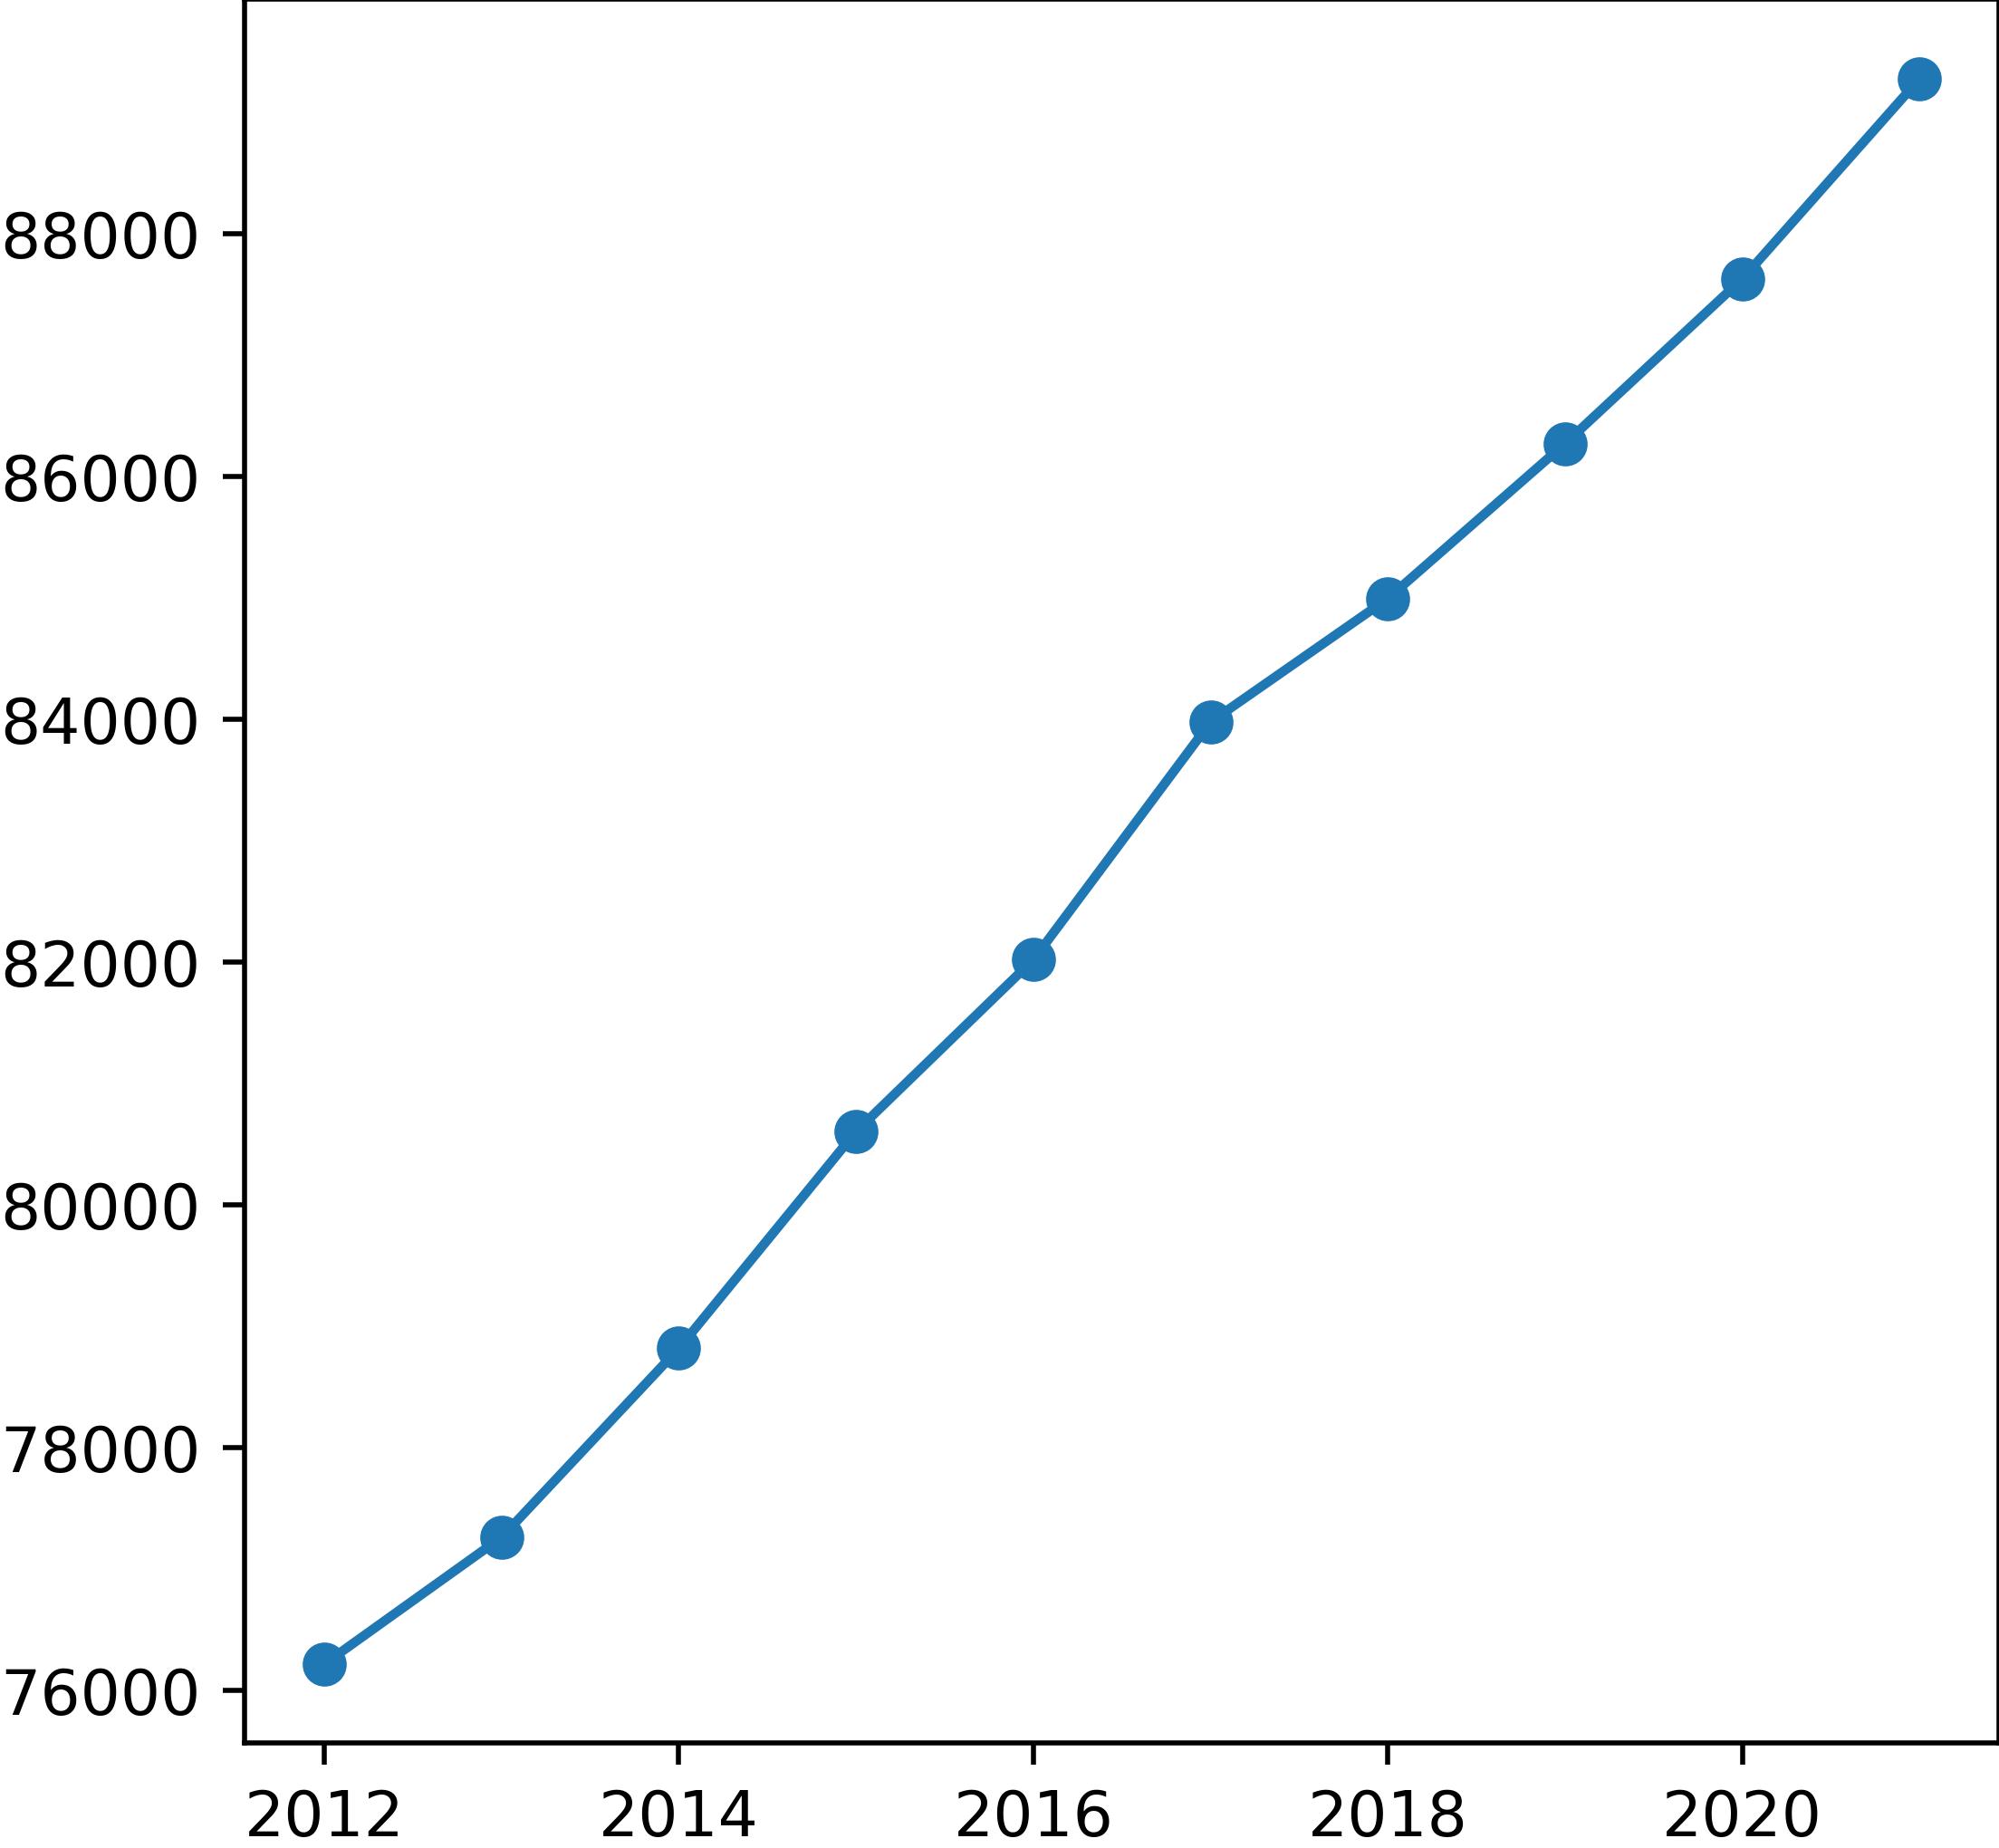
Figure 1 illustrates that the majority of ZIP Codes typically have approximately 1,500 establishments or fewer. However, there are some exceptions, like Downtown San Diego (92101), which boasts around 4,000 establishments. This tells us that a specific group of ZIP Codes holds the bulk of businesses in the area, and may have a large effect on the performance of our models.
Observing Figure 2 further reveals how data constraints have limited the data we have to work with, as our data contains no recession years. As a result, the overall number of establishments in the county consistently shows a pattern of continual growth, steadily increasing each year.
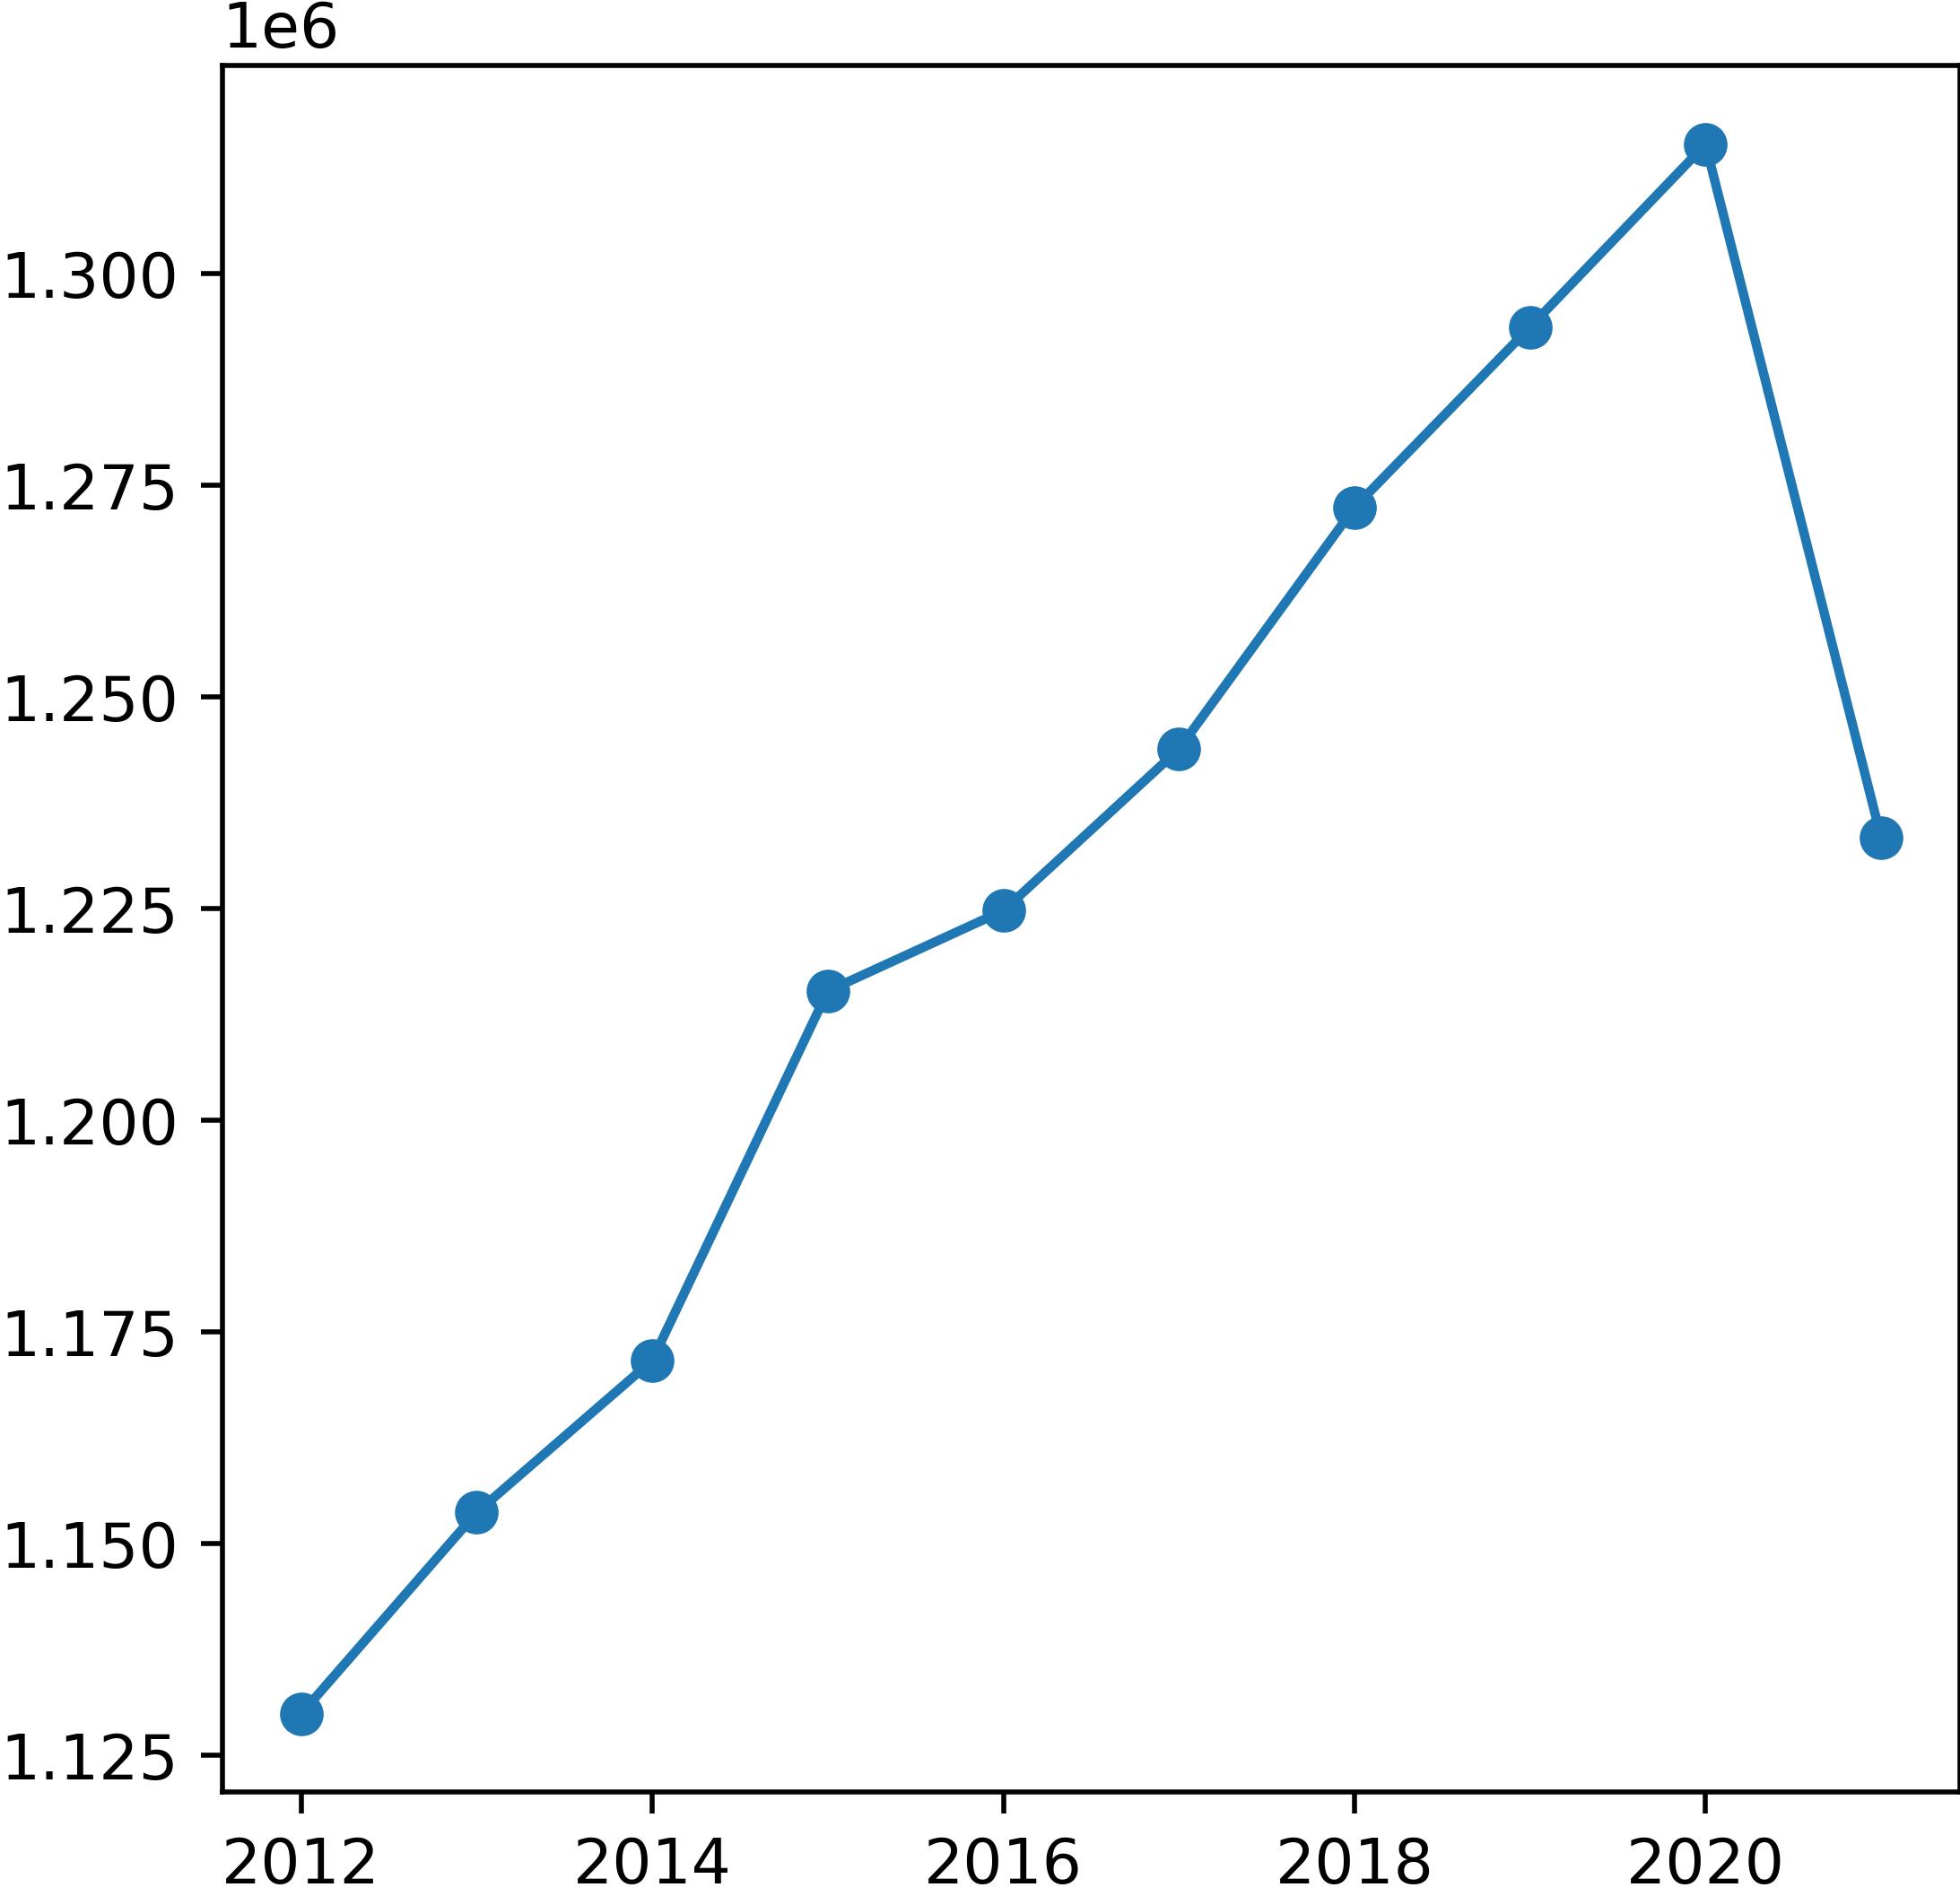
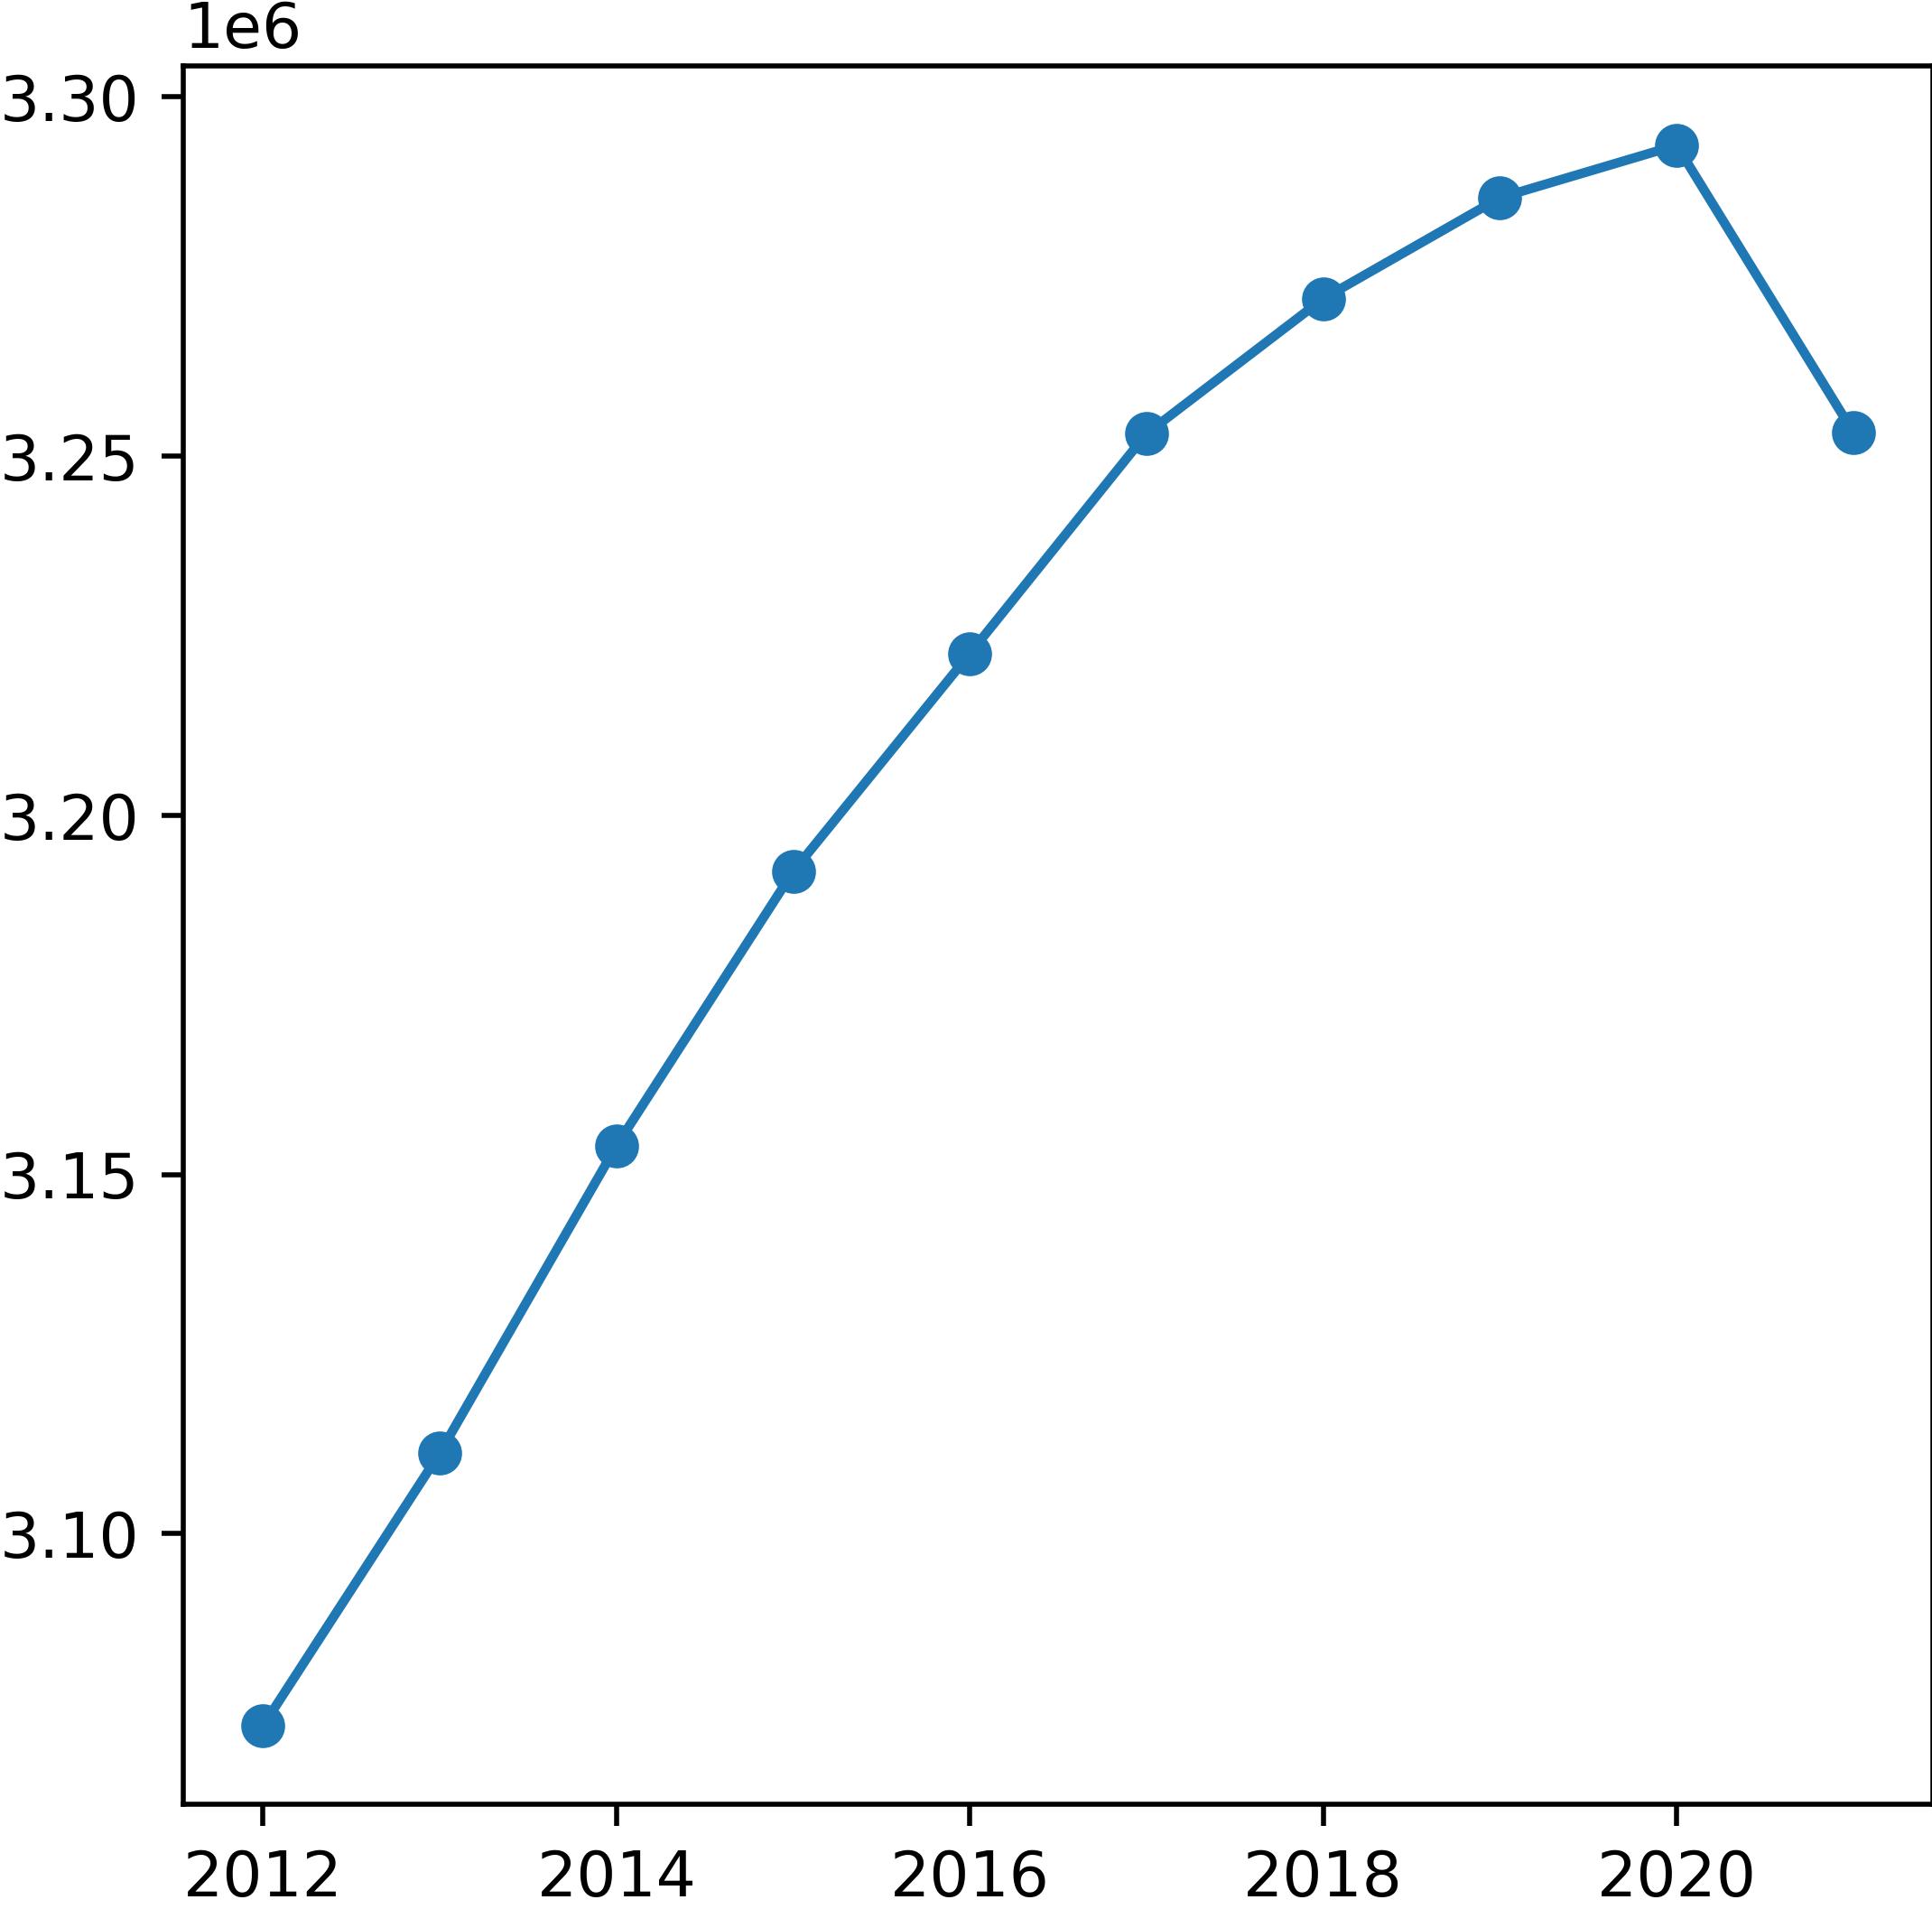
In Figures 3 and 4, noticeable declines in both employment and population are observed from 2020 to 2021, indicating the onset of the COVID-19 pandemic. Notably, this decline did not correspond to changes in establishment counts. This anomaly may be linked to initiatives such as the California Microbusiness COVID-19 Relief grant program, which injected funds into the economy to support the survival of small businesses.
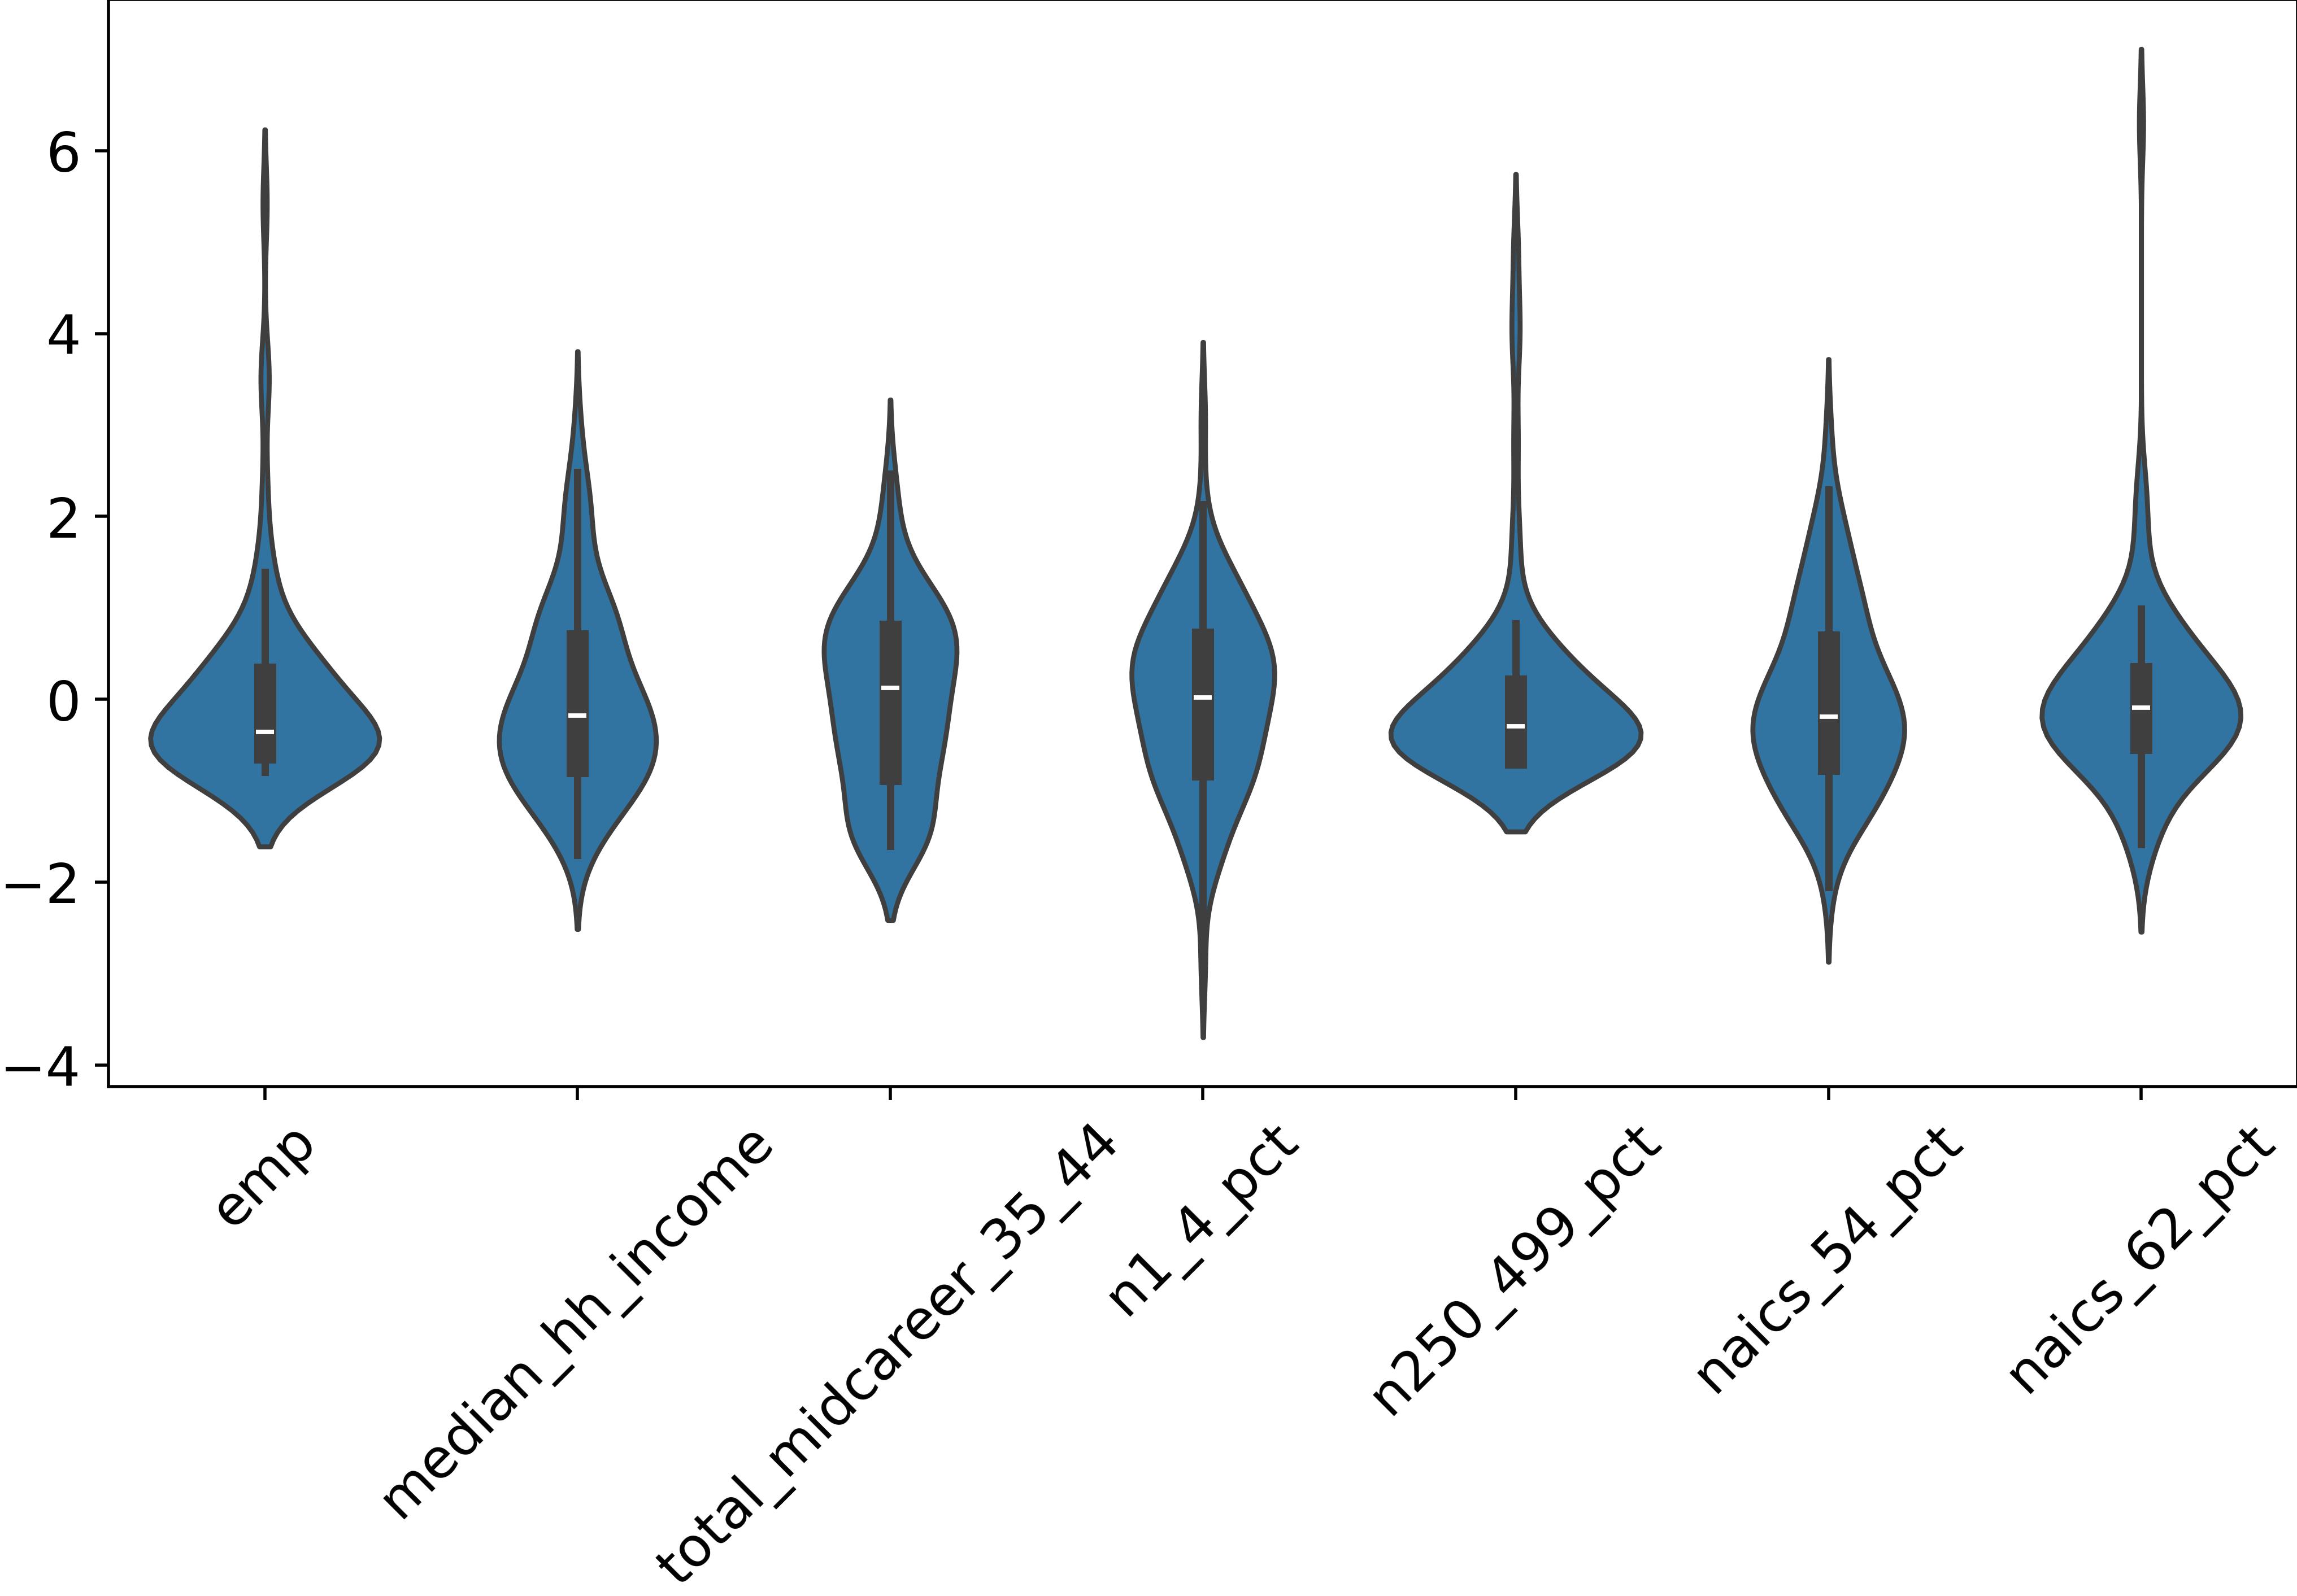
Looking at Figure 5, we see that some features have long right tails in their distributions, telling us that certain features tend to prefer certain types of ZIP Codes. For instance, smaller businesses seem to be spread out pretty evenly across ZIP Codes, while larger businesses have a few outliers. This suggests that certain ZIP Codes might be hotspots for big businesses, while smaller ones are more evenly distributed throughout the region.
When we look at the distribution of industries across ZIP Codes, we observe similar patterns, of right-tailed distributions. Some industries show a tendency to cluster together within certain regions, indicating a preference for co-location with similar businesses. For example, the health sector (naics_62) appears to exhibit this behavior more prominently compared to the management services sector (naics_54). This could be because the health sector often benefits from close proximity to other healthcare facilities for the efficient transfer of samples and patients. On the other hand, the management services sector, which primarily involves desk work, may not rely as heavily on physical proximity to other businesses.
Modeling Architectures
As we are focusing on discovering the potential of Algorithmic Machine Learning, we’ve broken down our modeling methods into two groups: Statistical and Algorithmic. In each group, we’ve compared a simple “baseline” model with another “theoretically best” model.
(Statistical) Linear Regression
What It Is:
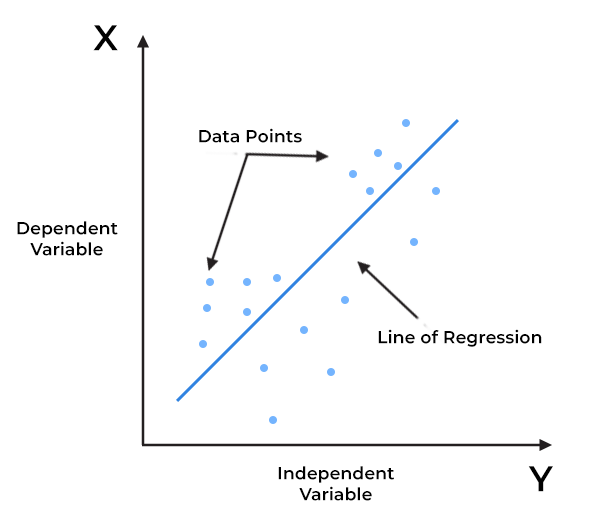
Linear regression is a statistical method used to model the relationship between two variables by fitting a straight line to the observed data points. It aims to predict the value of one-variable (dependent variable) based on the value of another variable (independent variable) by minimizing the difference between the observed and predicted values.
Because of their simplicity, they are traditionally used in econometrics for their interpretability. A quick modification of the simple one variable linear regression is multiple linear regression models, which are one of the simplest modeling techniques that can use multiple input features to predict a single variable.
Why We Think It’s Good:
We are mostly implementing this model for its simplicity and ease of explanation. However, ordinary least squares models have a limitation: they can only predict a steady rise or fall in data trends after what they’ve learned. This means they might not adjust well to unexpected changes, like economic recessions. During training, they may under-predict establishment counts for recession years, while during testing, they could significantly over-predict it, making forecasts all but useless. Since our data doesn’t include recession periods, though, this model might perform better than expected.
📝 NOTE: We also implemented a version of linear regression using L1 regularization (LASSO)
(Statistical) Autoregressive Integrated Moving Average: ARIMA
What It Is:
ARIMA, or Auto-Regressive Integrated Moving Average, is a statistical method used for time series forecasting. It employs a sliding window technique on past observations after accounting for stationary, and incorporating moving average terms to capture noise in the data. Unlike some other models, ARIMA models can only learn from data in the predicted variable, making it great for situations where you don’t have enough extra input features to work with. Because of this, it is a popular choice for forecasting models in use today.
The auto-regressive integrated moving average (ARIMA) is a classical model used for statistical time-series analysis which makes predictions by averaging a select number of previous observations, after accounting for stationarity, and cannot utilize multiple explanatory variables. This makes it well-suited for cases where time-series forecasts must be made without clean, structured explanatory variables, making it, currently, one of the most widely used forecasting model architectures in the industry.
Why We Think It’s Good:
While we explore various additional input features beyond what ARIMA models typically handle, we believe it’s still worthwhile to deploy the model as a representation of the current industry landscape. However, it’s important to acknowledge that our data lacks seasonality, as we’re making yearly predictions, which could potentially impact the accuracy of our forecasts.
(Algorithmic) Random Forest Regressor
What It Is:
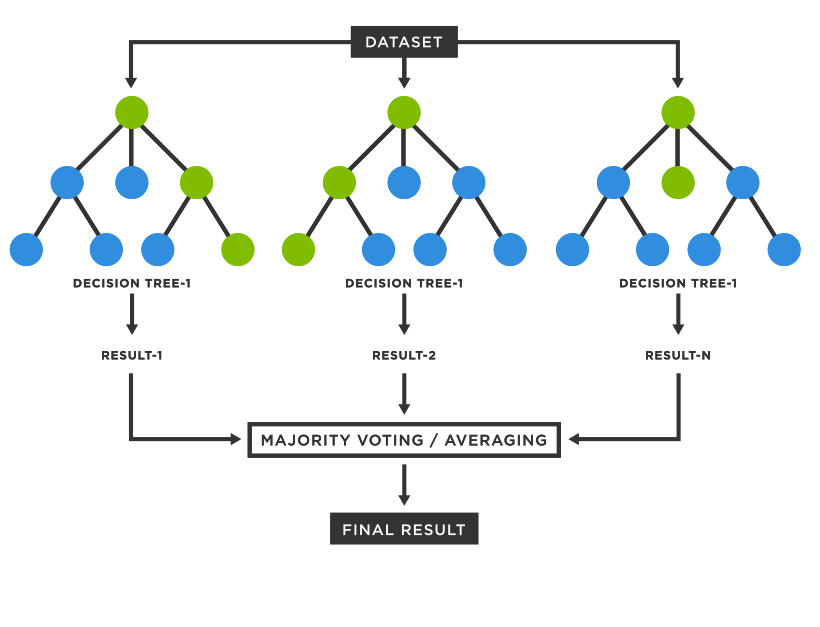
A random forest regressor is a machine-learning algorithm that builds multiple decision trees during training and outputs the average prediction of those trees for regression tasks. Each decision tree in the forest works by recursively partitioning the data into smaller regions by making decisions based on feature information, aiming to create splits that best separate the target variable into distinct groups. The inference is done by each tree by following the set of decisions/rules made during training until a prediction is reached.
Why We Think It’s Good For Our Problem:
Because random forest models make very few assumptions about the data, its power mostly comes from the amount of information that resides inside the extra input features used, leading it to often perform well on all sorts of datasets. With all the new input features we collected, we think it would make a good candidate for our problem.
(Algorithmic) Long Short-Term Memory Neural Network: LSTM
What It Is:
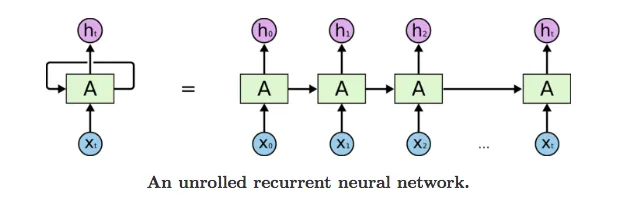
Neural networks are a class of machine learning models inspired by the structure and function of the human brain. They consist of interconnected nodes, or neurons, organized into layers. Information flows from the input layer through hidden layers to the output layer, with each layer performing computations on the input data, making them capable of learning complex patterns and relationships in data. Recurrent neural nets are a type of neural network designed to handle sequential data, where the order of the data points matters, such as time-series prediction. Long short-term memory networks (LSTMs) are a specialized type of recurrent neural network that have more complex hidden state mechanisms making them particularly effective for tasks involving long-range dependencies.
Why We Think It’s Good:
LSTM neural networks have a special knack for remembering information from a long time ago, even stretching back hundreds or thousands of time points. This makes them perfect for predicting things like economic recessions, which don’t happen very often and don’t follow predictable patterns.
Unlike ARIMA models that cannot handle any extra input data, LSTMs are flexible. They can crunch numbers from any number of sources at each step, which means they can spot trends and patterns that other models might miss. It’s like having the best of both worlds: the ability to effectively understand irregular changes over time combined with the ability of OLS to make use of new data sources.
Results
How We Evaluated Our Models
In testing our new forecasting models, we looked at two different scenarios: short-term forecasting for the immediate next year, and long-term forecasting. For the short-term tests, we trained our models on data spanning from 2012 to 2020 and then checked their accuracy against the real data from 2021. As for the long-term forecasting, ideally, we’d like to see how well our predictions hold up many years down the line, similar to what SANDAG does with their Series 14 Forecasts, which which forecast to 2050 starting from data in 2016. However, given our limited data range, we trained our models on data from 2012 to 2018 and then compared their predictions to the real data from 2019 to 2021.
We used root mean squared error (RMSE) to measure how well our model performed, making it easier to compare our results with previous works.
Our Final Results
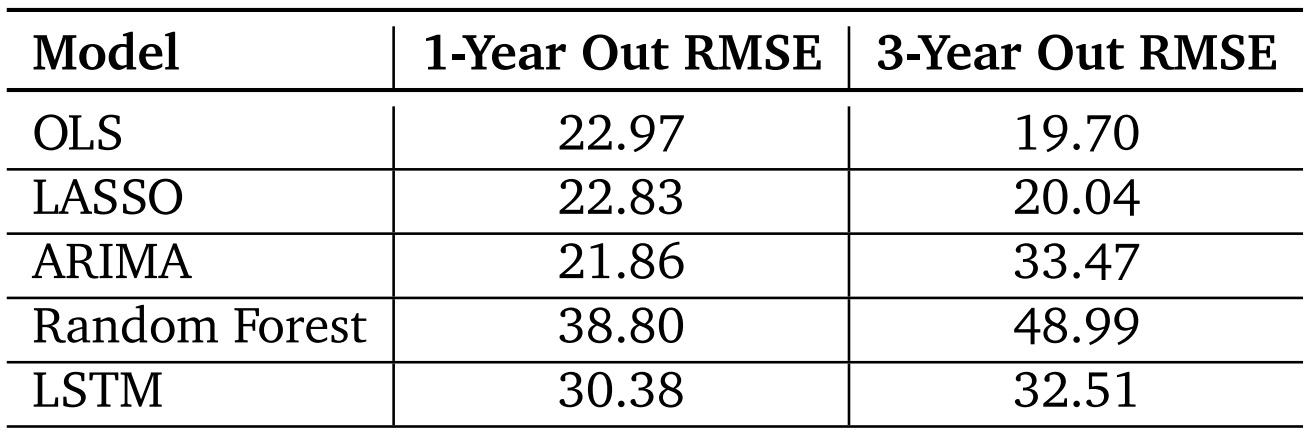
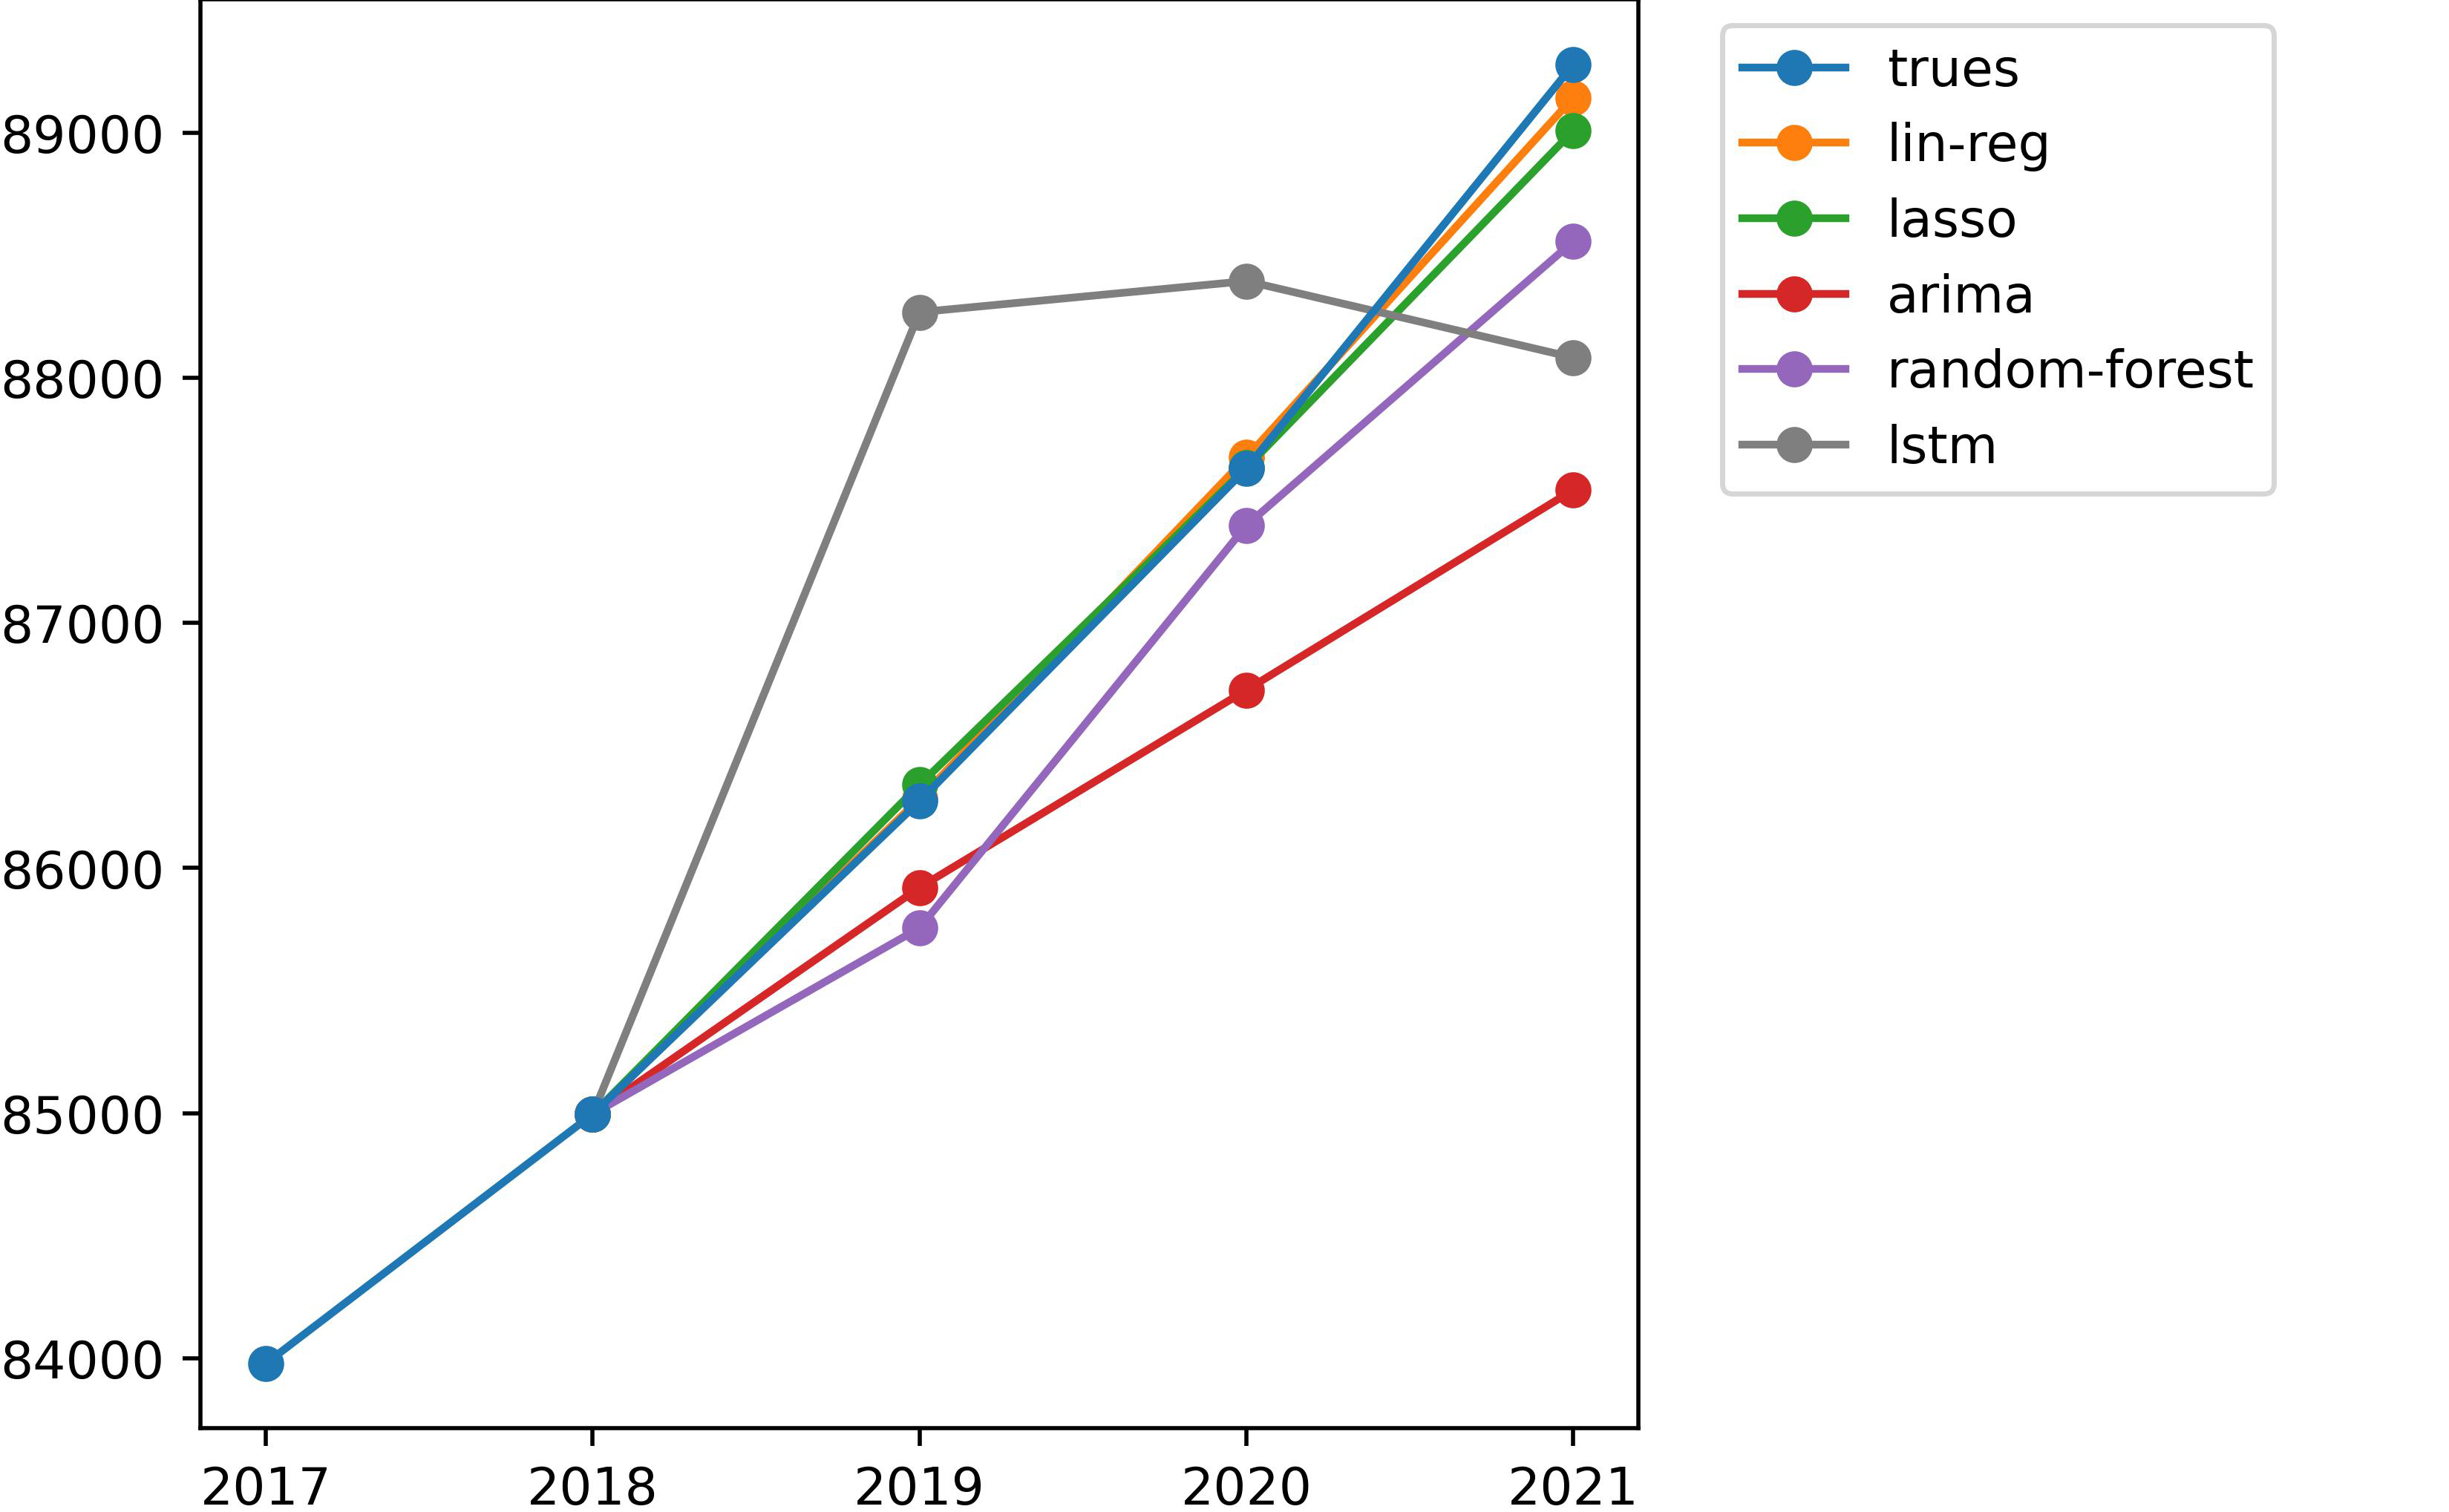
In our analysis, we found that simpler models like ordinary least squares (including LASSO) ended up producing the most accurate predictions for establishment growth. This is likely because they assume a steady increase in growth over time, which matches what we’ve observed in both our training and testing data.
On the other hand, our ARIMA model consistently underestimates establishment growth. This happens because it bases its predictions on the recent past, and each time it makes a prediction, it tends to lower its estimate even further. This cautious approach might be preferable though, as it avoids the risk of overestimating growth, which could lead to even worse misguided planning decisions.
The more complex “Algorithmic Models” we tested, like random forest and LSTM, didn’t perform as well in terms of accuracy. However, they did offer more dynamic predictions, giving us hope that they can adapt quickly to changes in the data. This flexibility could be particularly useful during economic downturns. One reason they might not perform as well could be because we didn’t have enough diverse data to train them properly, leading to overfitting on the training data.
Overall, our findings suggest that simpler statistical models tend to be more reliable for forecasting establishment counts by ZIP Code. LASSO regression, in particular, stood out with the lowest testing errors. However, it’s important to note that our results could have been influenced by the specific data we used, which didn’t include many recession years. This could have favored models like ordinary least squares, which assume steady growth, when in reality, economic conditions might fluctuate more.
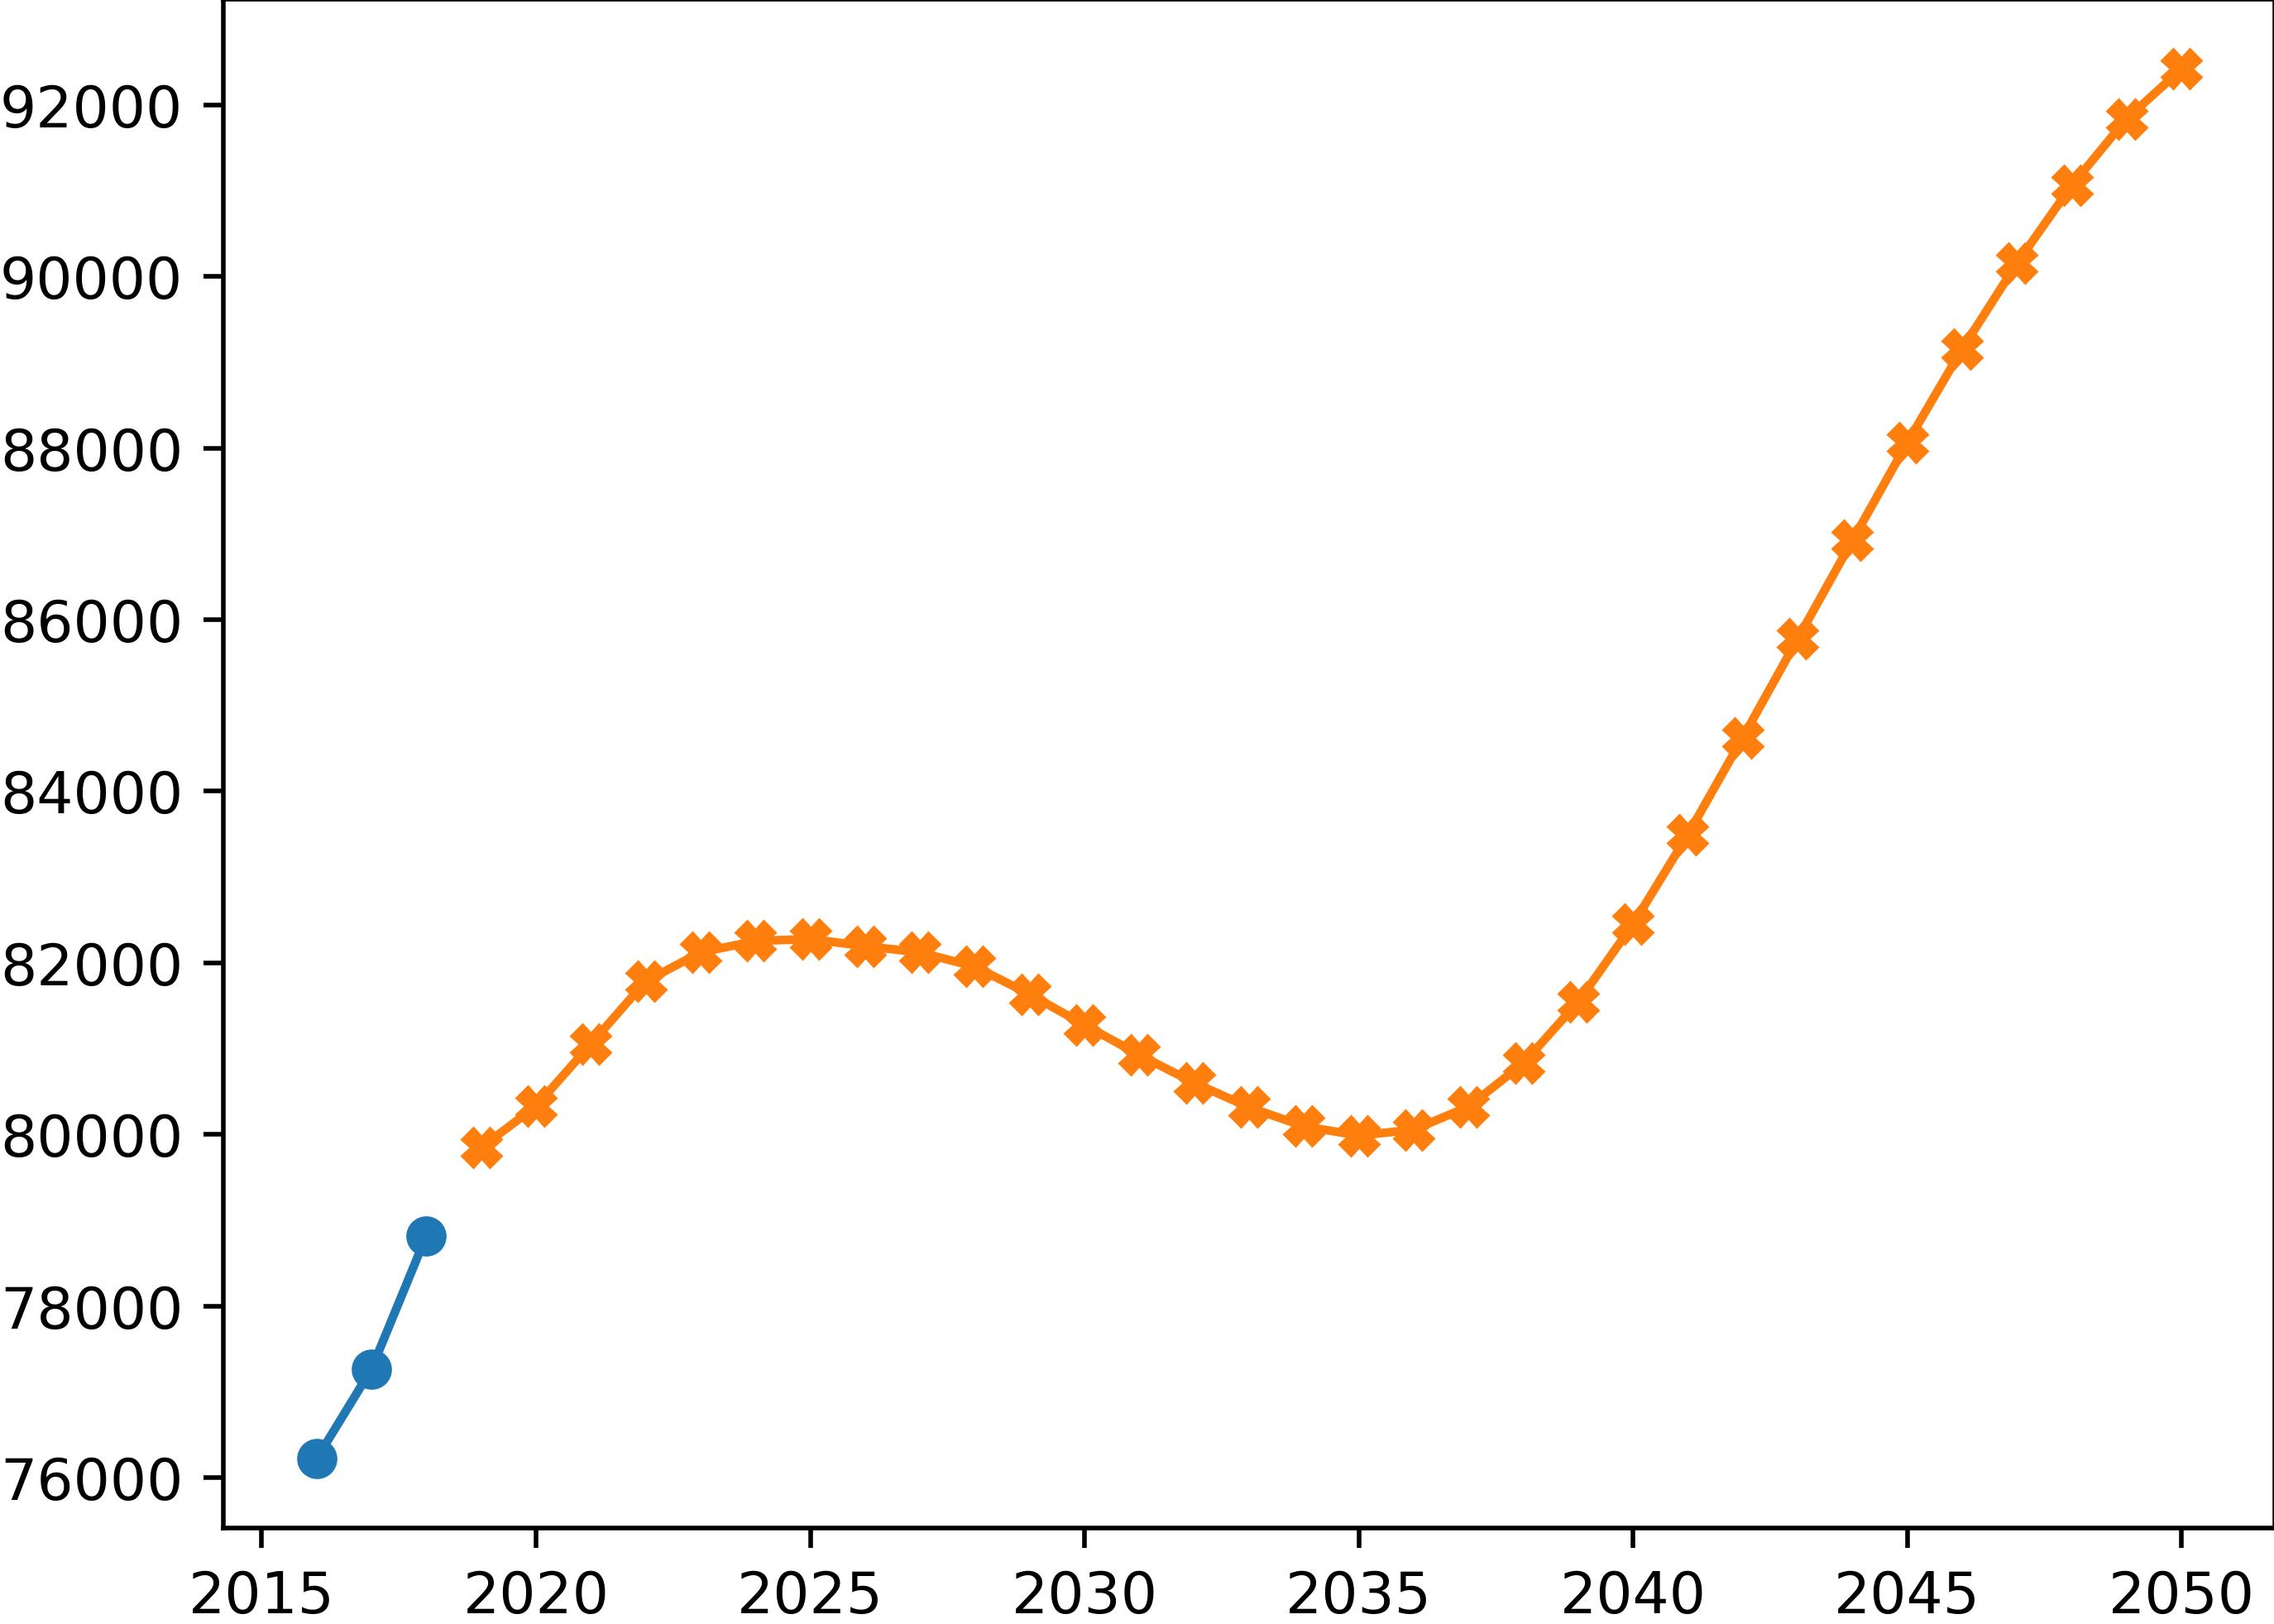
Figure 7 displays forecasts for the total number of establishments across San Diego County up to the year 2050, produced by one of our modified (auto-regressive feedback) LSTM models. These forecasts indicate an initial growth in establishments followed by decay, eventually leading back to exponential growth.
Future Work
In the future, we aim to expand our project by analyzing longer-term data that spans multiple recession periods and incorporates monthly variations. This will allow us to delve deeper into the effectiveness of “Algorithmic Modeling,” especially for predicting business growth or decay during periods of recession.
We also plan to investigate our input features further, taking cues from the performance of our random forest model. Despite being the least accurate among our models, with RMSE scores of 38.80 for one-year forecasts and 48.99 for three-year forecasts, this model sheds light on the limitations of our current features. It suggests that while our features might explain variations in business activity across different areas, they struggle to effectively capture variations in business growth over time. Hence, we’ll explore alternative features to enhance our forecasting accuracy.
Although we’ve primarily used RMSE for evaluation purposes, it’s important to acknowledge its limitations. It may lead our models to overfit on ZIP Codes with a high concentration of businesses, potentially resulting in poorer predictions for emerging areas that need development support. To address this, we plan to explore alternative evaluation metrics that can mitigate such biases and ensure fair predictions across all areas, thereby avoiding algorithmic injustice.